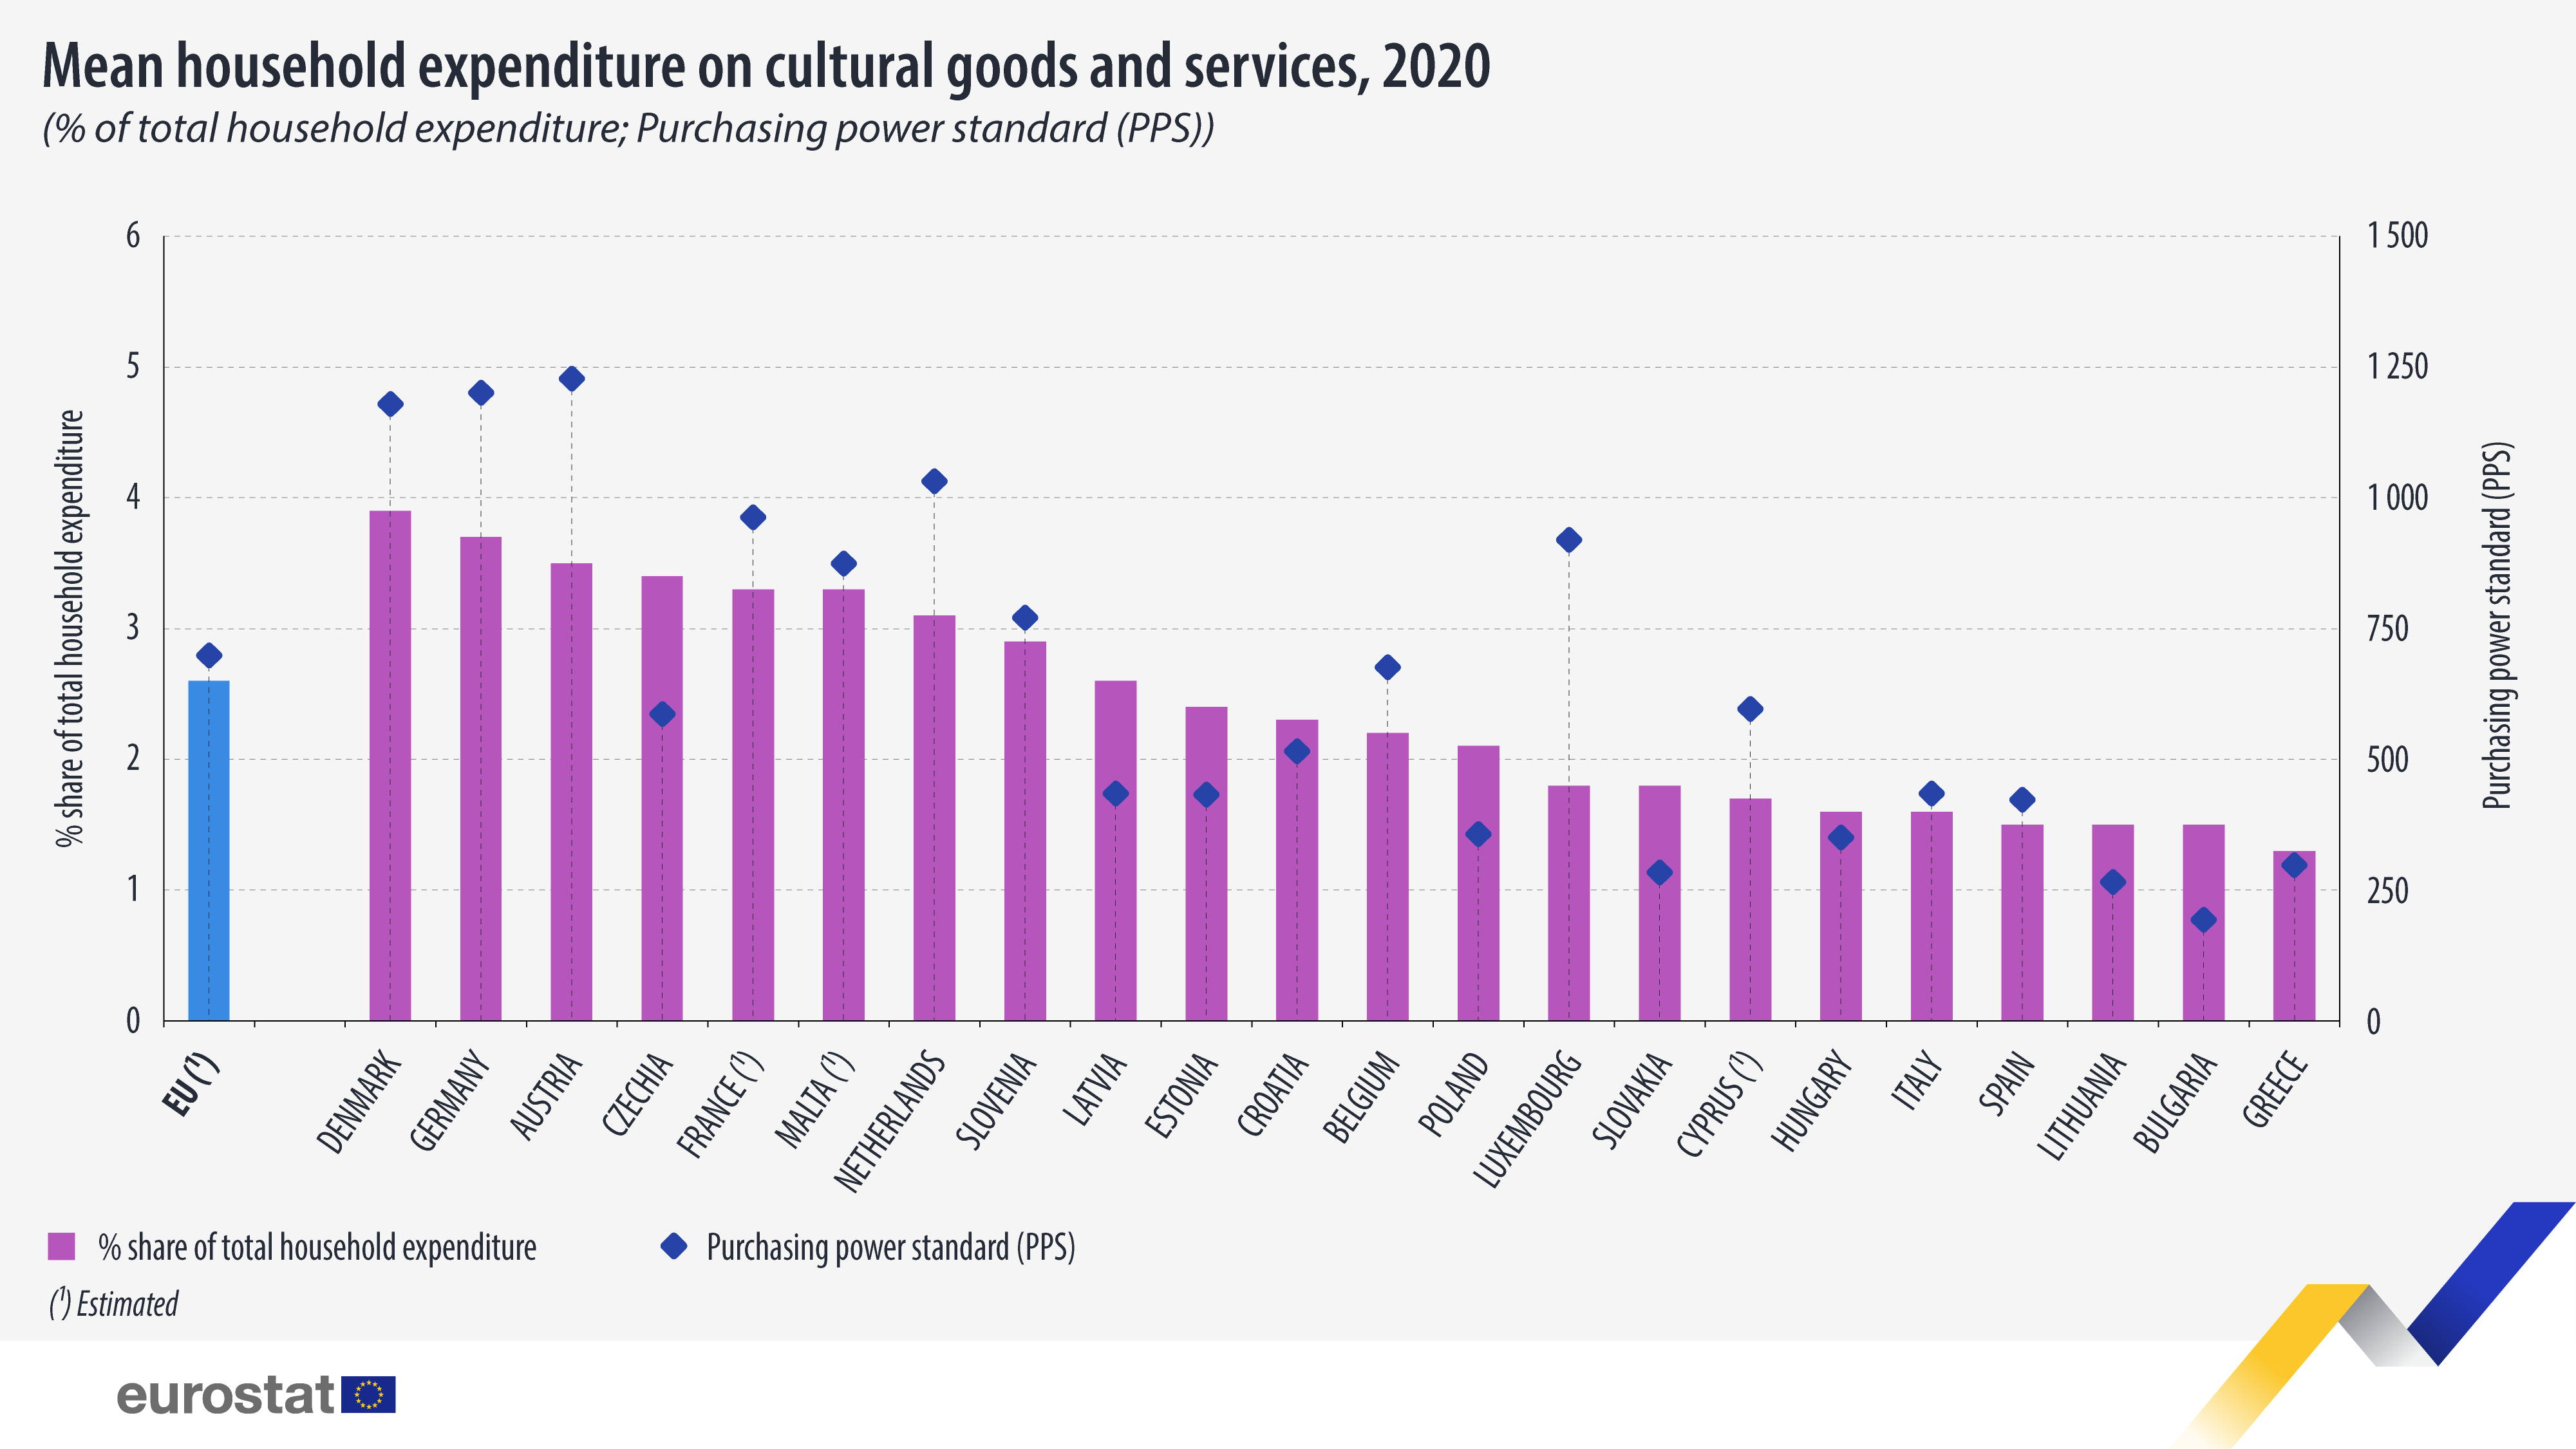
In 2020, households in the EU spent, on average, an estimated 2.6% of their total expenditure on cultural goods and services. The share of culture-related expenditure in total household consumption spending varied considerably across EU countries. Several factors might impact this share, including household income, price levels, the ease of access to cultural venues, national cultural policies, and habits.
In 2020, 8 countries recorded a share of cultural expenditure in the total household budgets above the EU average, based on the 22 EU countries with available data. The highest percentages of the household budget spent on cultural purposes were in Denmark (3.9%), Germany (3.7%) and Austria (3.5%).
By contrast, in 13 EU countries the share of household expenditure on cultural goods and services was below the average at the EU level, with the smallest share in Greece (1.3%). Bulgaria, Lithuania and Spain followed closely, each recording a share of 1.5%.
Expressed in purchasing power standard (PPS), Austria (1,221 PPS), Germany (1,194), Denmark (1,173) and the Netherlands (1,026) had the highest levels of expenditure on cultural goods and services in 2020. At the other end of the scale, the average household expenditure on cultural goods and services was less than 300 PPS in Bulgaria (193), Lithuania (264), Slovakia (282) and Greece (296).
On average, around one-fourth of the EU households’ expenditures on culture in 2020 went on computer and audio-video equipment (26.9%), another one-fourth on books and press (25.1%), one-fifth (20.8 %) on broadcasters’ fees and hiring of equipment and accessories for culture, and 13.7% on attendance and entertainment, leaving the remaining 13.5% for articles of artistic expression and creation.
Source dataset: cult_pcs_hbs
More information
- Statistics Explained article on household expenditure on culture
- Thematic section on culture
- Database on culture
Methodological notes
- Data for this article are from household budget surveys (HBS) in which EU Member States collect households’ consumption expenditure on goods and services. Eurostat disseminates the household budget survey data every 5 years; the most recent results are for 2020.
- Data for France, Malta and Cyprus have been produced from the HBS 2015, by converting 2015 to 2020 reference year prices using the 2020 harmonized index of consumer prices (HICP) coefficient.


